crime.pulse
Last updated

Los Angeles · Drugs & public health

See the trend.

What changed, how much, and over which years.

Explore recorded drug offences and available overdose deaths. Each measure keeps its own definition and geography.

Compare with other cities →

On the ground

Independent street reporting

Los Angeles,
on the ground.

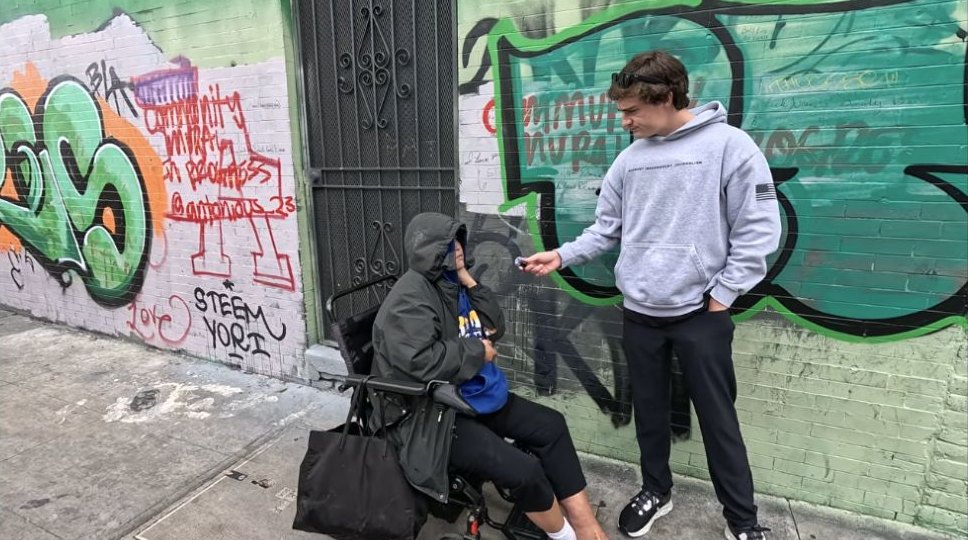
On Skid Row, Shirley interviews people about painkillers and drugs, including a mother and her son. The next chapter is his account of being ordered out of MacArthur Park.

Watch this city 22:34 ↗

Published

Two ways to understand a place. These are the reporter’s observations and interviews at particular locations. The charts below track separately recorded police offences and available deaths across their stated geographies; they do not measure everything seen in the film.

Explore the data

Arrest reports and NIBRS offenses are different counts. 2024 appears in both because the arrest file still covers that calendar year and NIBRS starts on 7 March 2024. They are not joined into one line.

Overdose deaths are Los Angeles County, not the City of Los Angeles. They are not used to shade neighbourhood councils.

01 / Police data

Drug offence trends

Select a measure to inspect its trend. Missing years stay blank; partial years stay separate.

City of Los Angeles

Narcotics arrest reports

Last updated Reviewed dataset

Latest complete year · 20245,805arrest reports
Year over year+16.9%2023 → 2024
Change since 2016−52.6%2016 → 2024
Annual trend · complete years
arrest reports2024 · 5,805
06.9K13.7K2016: 12,2592017: 11,5802018: 11,0942019: 11,0312020: 6,5352021: 5,4692022: 4,9182023: 4,9652024: 5,805201620202024
View chart data
Narcotics arrest reports · arrest reports · complete years
YearValue
201612,259
201711,580
201811,094
201911,031
20206,535
20215,469
20224,918
20234,965
20245,805

02 / Public health

Overdose deaths

Deaths are a separate measure. Police counts do not measure overdose deaths or drug use.

Los Angeles County

Accidental drug overdose deaths

Last updated Reviewed dataset

Latest complete year · 20252,298deaths
Year over year−5.9%2024 → 2025
Change since 2016+104.6%2016 → 2025
Annual trend · complete years
deaths2025 · 2,298
01.8K3.6K2016: 1,1232017: 1,1562018: 1,2042019: 1,6522020: 2,5702021: 3,0102022: 3,2202023: 3,1372024: 2,4422025: 2,298201620212025
View chart data
Accidental drug overdose deaths · deaths · complete years
YearValue
20161,123
20171,156
20181,204
20191,652
20202,570
20213,010
20223,220
20233,137
20242,442
20252,298

Compare available death trends →

03 / Behind the numbers

Sources & coverage

Last updated 2026-10-01 · accepted source review.

  • 27 NIBRS 35A/35B rows are dated before 7 March 2024 and are left out of both series.
  • There is no neighbourhood drug map.
  • These measures are not added into a drug index or used to rank cities. There is no neighbourhood drug map.
Los Angeles Police Department · Arrest Data from 2010 to 2019 and Arrest Data from 2020 to 4/30/2025

Open source ↗ · Last updated 2026-10-01 (reviewed)

City of Los Angeles · 2010–2019 file is CC0. The 2020–30 April 2025 file does not state CC0; attribute the Los Angeles Police Department.

Los Angeles Police Department · NIBRS Offenses Dataset

Open source ↗ · Last updated 2026-10-01 (reviewed)

City of Los Angeles · Published by LAPD on data.lacity.org. Attribute the Los Angeles Police Department. Do not mark these rows CC0.

Los Angeles County Department of Public Health · Data Report: Drug Overdoses in Los Angeles County, June 2026

Open source ↗ · Last updated 2026-10-01 (reviewed)

Los Angeles County · County public-health report. Table totals for accidental drug overdose deaths, 2016–2025. The age groups in that table sum to these annual totals.